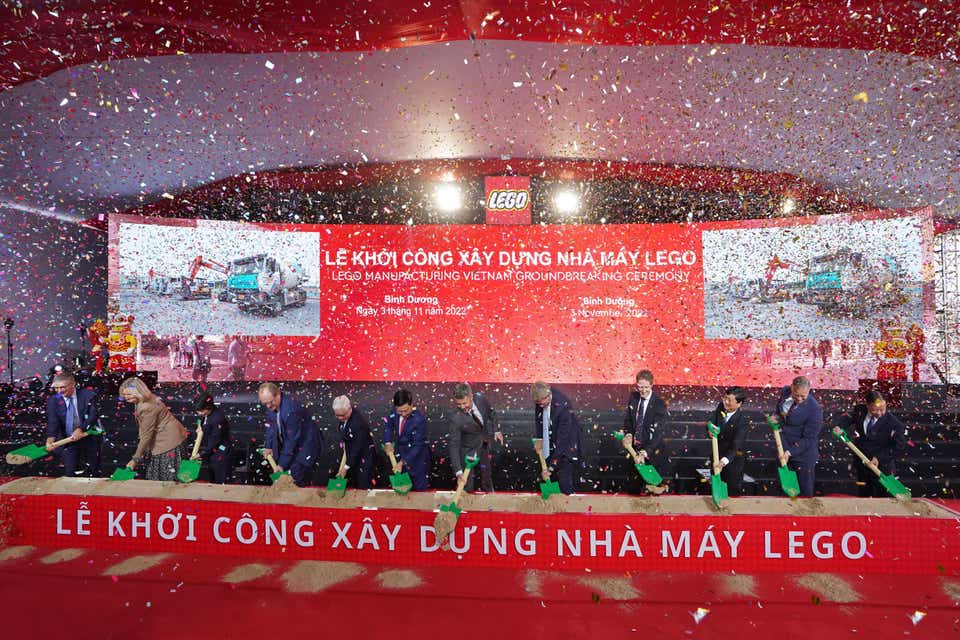
LEGO has announced that they have broken ground on the new $1 billion factory in the Binh Duong Province of Vietnam. The factory is designed to be the most sustainable one in their portfolio and will be the sixth in Asia to support growth in the region. What’s interesting is that the factory design is inspired by local children’s LEGO builds.
THE LEGO GROUP BREAKS GROUND ON NEW USD 1 BILLION VIETNAM FACTORY
• Ceremony attended by His Royal Highness Crown Prince Frederik of Denmark and His Excellency, Standing Deputy Prime Minister of Vietnam, Pham Binh Minh.
• Company’s sixth factory globally and second in Asia will support growth in the region.
• Facility is designed to be the company’s most sustainable to date.
• Factory design inspired by local children’s LEGO® builds.
• Company commits US $150,000 to support children in need.
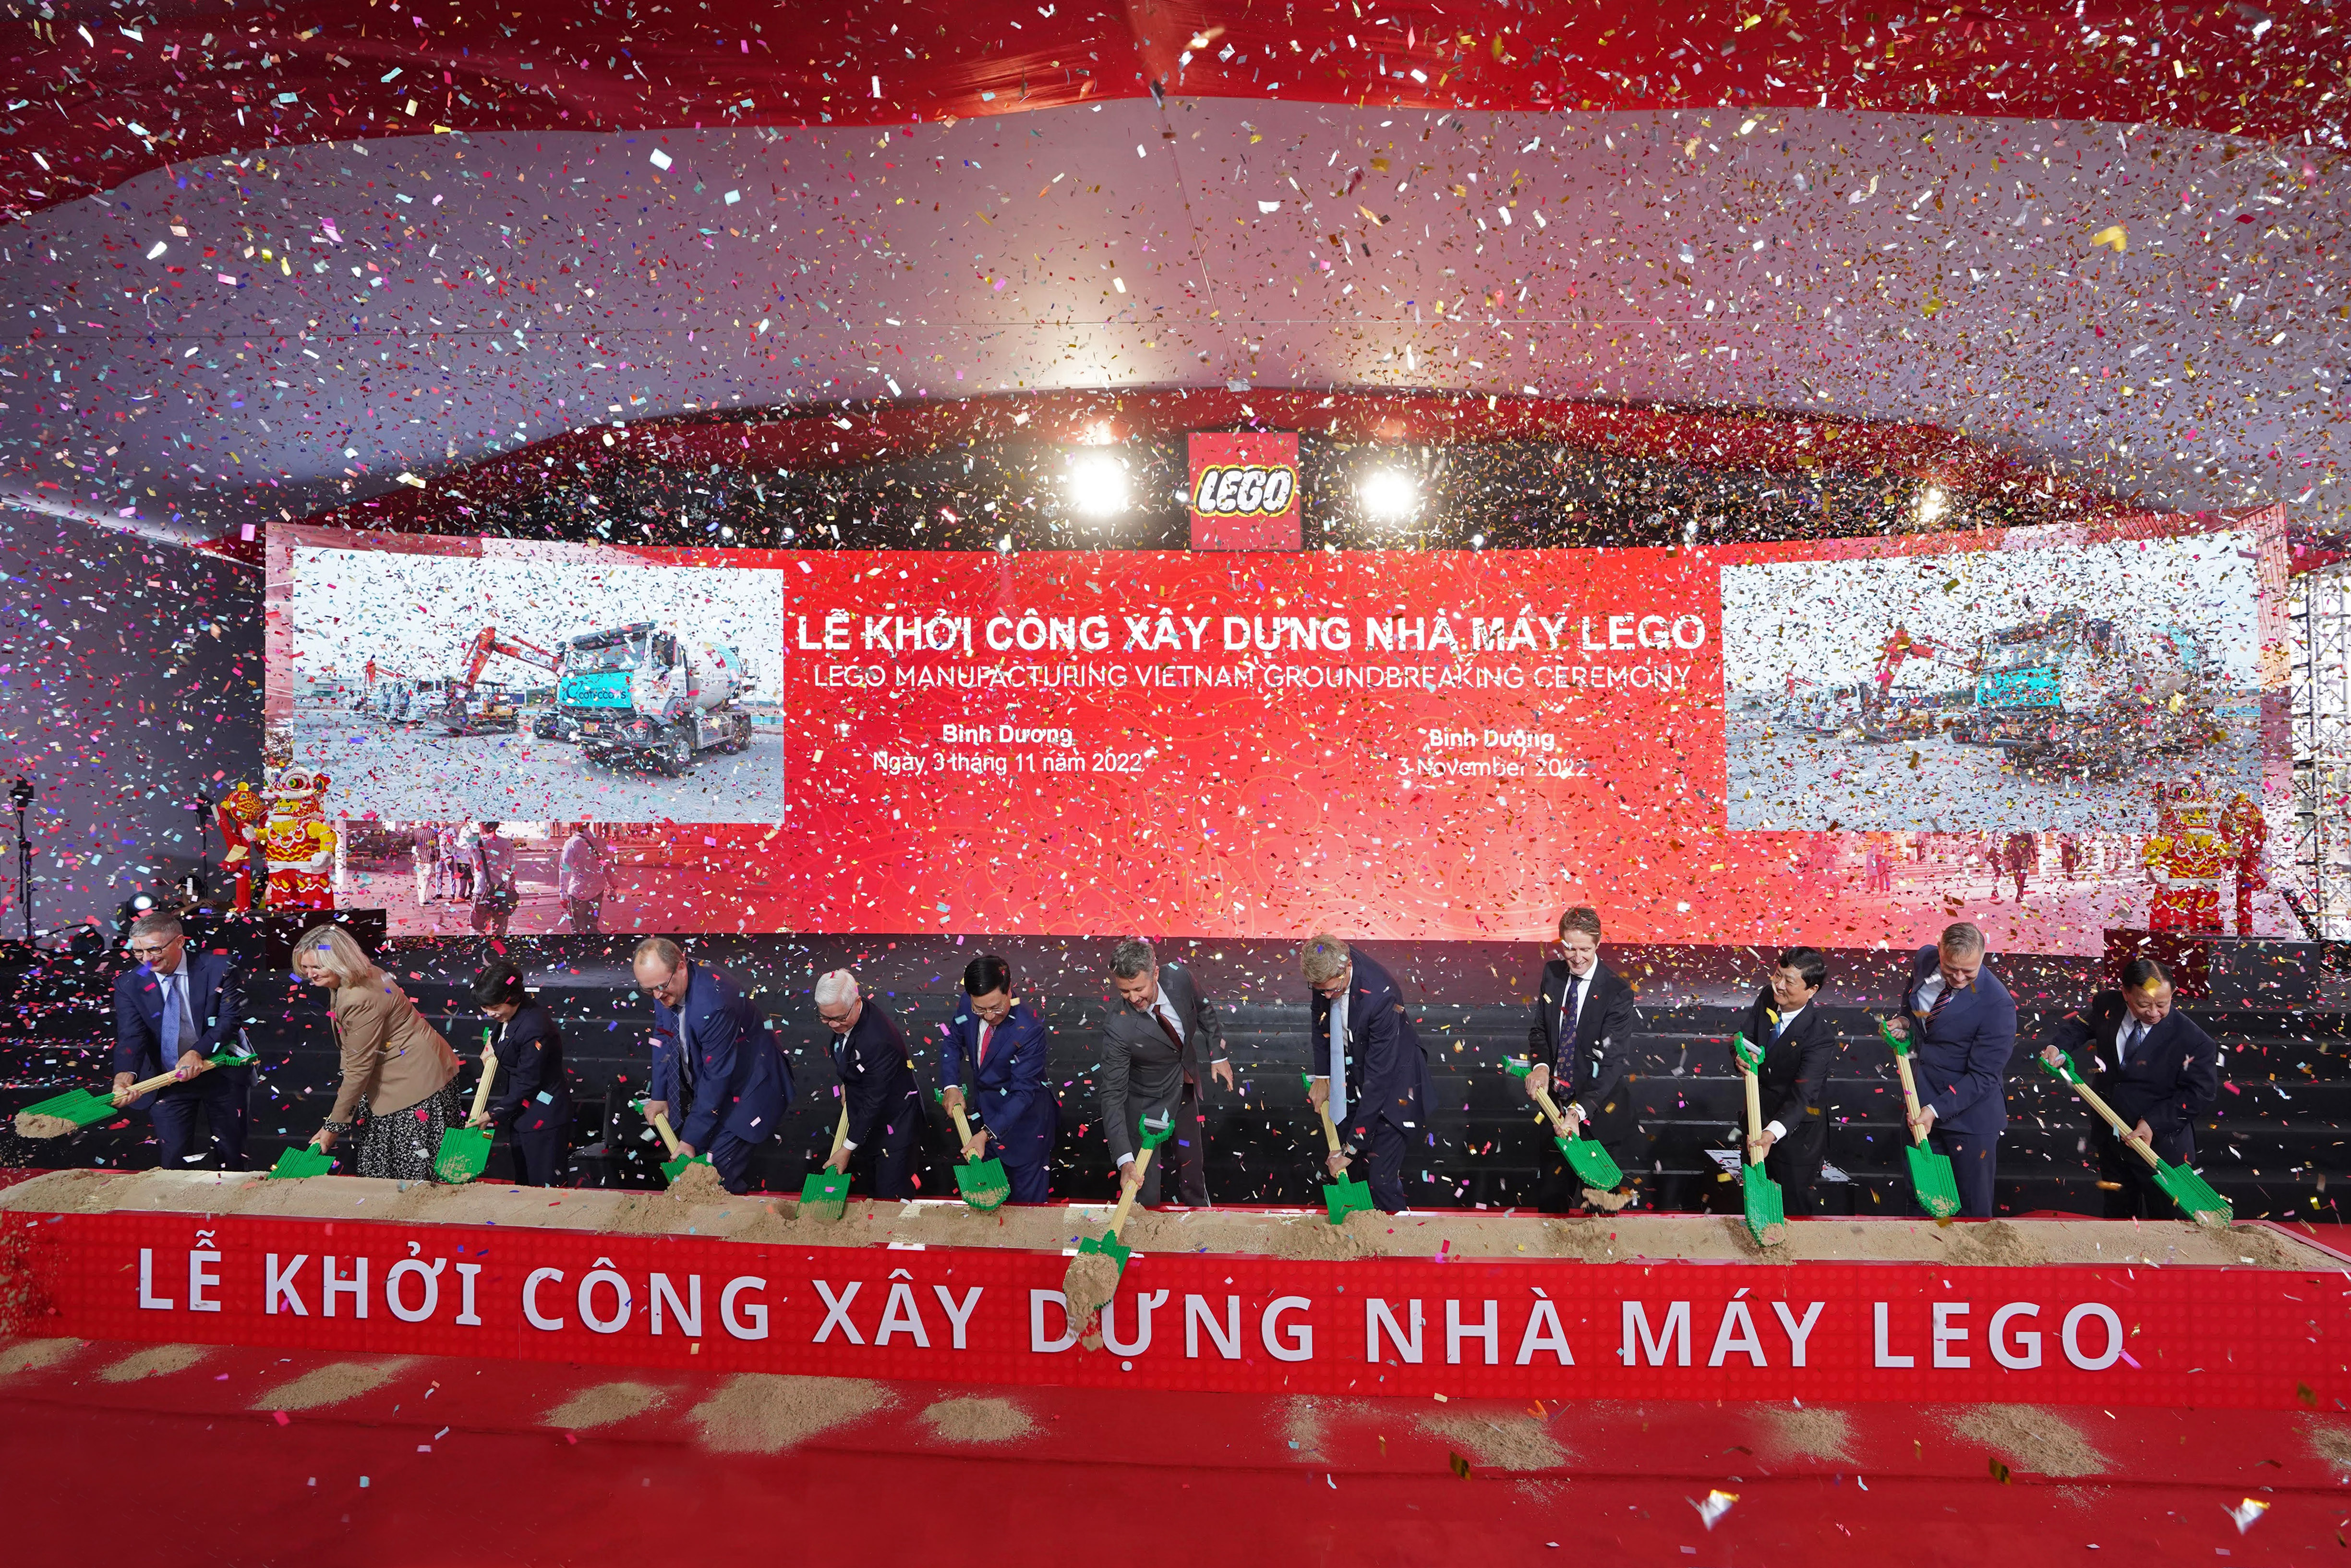
Billund, November 3, 2022: The LEGO Group today celebrated breaking ground at its new US $1 billion factory in the Binh Duong Province in Vietnam, bordering Ho Chi Minh City to the South. This is the largest investment by any Danish company in Vietnam and part of the company’s strategy to expand its supply chain network to support long-term growth and locate production facilities close to its major markets.
The groundbreaking event was attended by His Royal Highness Crown Prince Frederik of Denmark and His Excellency, Standing Deputy Prime Minister of Vietnam Pham Binh Minh, LEGO Group Chief Executive Officer Niels B. Christiansen, LEGO Group Chief Operations Officer Carsten Rasmussen, national and provincial
…
Continue